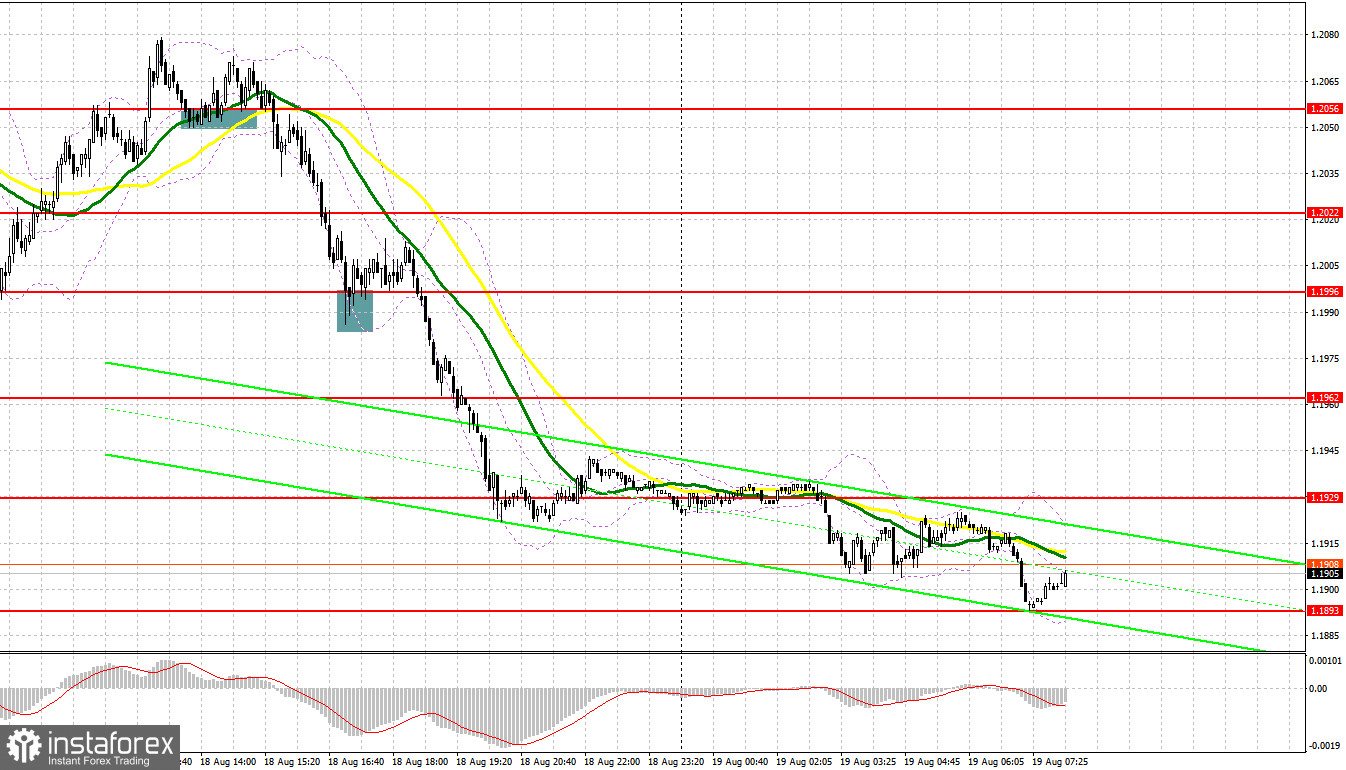
Quite a lot of interesting market entry signals were formed yesterday. Let's take a look at the 5-minute chart and see what happened. I paid attention to the 1.2019 level in my morning forecast and advised making decisions from it. A momentary breakthrough of 1.2019 occurred along with a reverse test from the bottom up, which seemed to give an excellent signal to sell the pair in continuation of the bearish trend. But, as it usually happens, the market went against the speculators, and before falling, shook out everyone who was even above the daily highs, so we had to take losses. A reverse test of 1.2056 gave a buy signal in the afternoon, but it was a mistake - again losses. According to my levels and strategy, I did not wait for a normal entry point into short positions. I tried to do something on a false breakout from 1.1996, but after moving up by 20 points, the pair was under pressure again, and we flew further down.
When to go long on GBP/USD:
The volume of retail sales in the UK will be released today. Most likely, this show will indicate a further reduction in sales due to high inflation, as well as a slowdown in the economy, which will negatively affect the British pound. But what the big players will do with this information remains a mystery: a new major drop in the pair may occur, or bad statistics can be used to take profits. The moment the speculators sell, the big players will exit the market. Of course, the best scenario for buying the pound would be a false breakout in the area of 1.1879, movement to which may occur immediately after the release of statistics on retail sales. In this case, we can expect a surge of GBP/USD up to the level of 1.1933, formed at the end of yesterday. A breakthrough and test from top to bottom at 1.1933 will indicate the completion of the weekly bearish trend and lead to profit taking with a buy signal and growth to a more distant level of 1.1974, where I recommend taking profit. In addition, there are also moving averages, limiting the upward potential.
If the GBP/USD falls and there are no bulls at 1.1879 after the weak data, the pressure on the pair will only increase. In this case, I advise you to postpone long positions until the next support at 1.1843. You can buy there only on a false breakout. I recommend opening longs on GBP/USD immediately for a rebound from 1.1806, or even lower - around 1.1762, counting on correcting 30-35 points within the day.
When to go short on GBP/USD:
Bears keep the market under their control and are ready to further actively dispose of risky assets - there would be a reason. The best scenario would be to sell the pound on the rise from the resistance of 1.1933, movement towards which may occur after the release of reports on the state of the British economy. Forming a false breakout at this level will provide a good entry point for a new decline and a new weekly low near 1.1879. A rather active struggle may begin for this level, especially if a divergence is fixed on the MACD indicator. A breakthrough and reverse test of this range will provide a sell entry point with a fall towards 1.1843. A more distant target will be the area of 1.1806, where I recommend taking profits.
In case GBP/USD grows and there are no bears at 1.1933, the chances of a larger upside correction would seriously rise, and bulls would have an excellent chance of returning to 1.1974. Only a false breakout there will provide an entry point into short positions, counting on the pair moving down. If there is no activity there, I advise you to sell GBP/USD immediately for a rebound from 1.2009, counting on the pair's rebound down by 30-35 points within the day.
COT report:
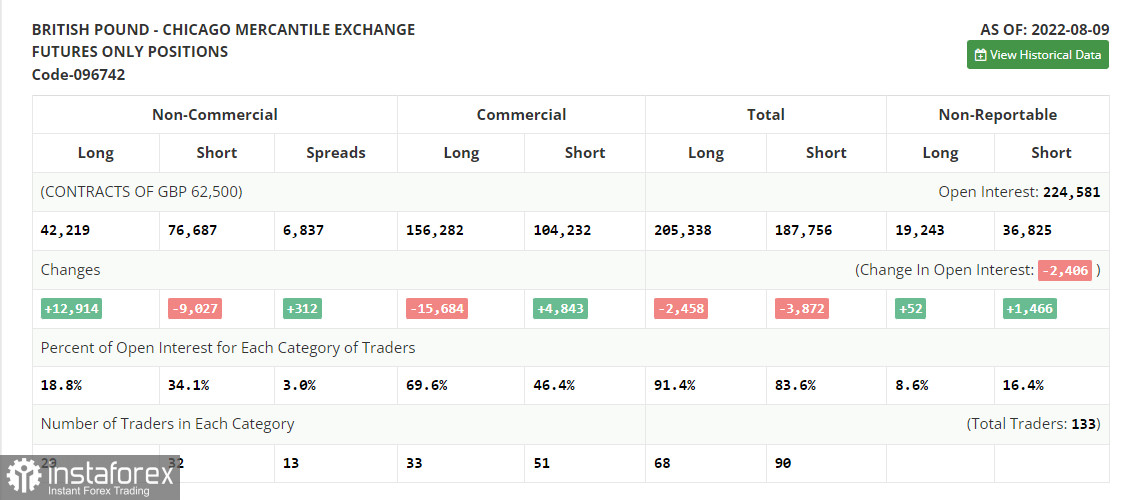
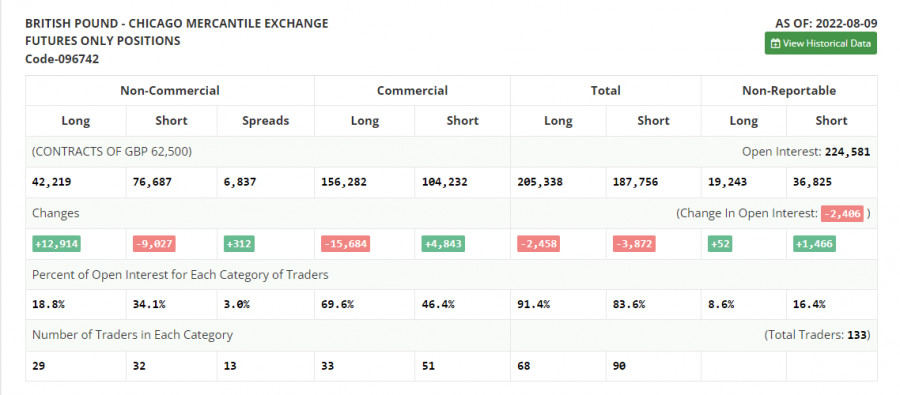
According to the Commitment of Traders (COT) report from August 9, short positions declined, while long positions increased, which led to a decrease in the negative delta. And while a slower contraction in UK GDP in the second quarter of this year will help give us hopes that the economy will weather this crisis more resiliently, it does not make households pay less on their bills, which only exacerbates the crisis in the cost of living in the country. Talk that by the end of this year the UK economy will slide into recession also does not give confidence to traders and investors. Do not forget about how the Federal Reserve's decision affects the GBP/USD pair. Last week it became known that inflation in the US slowed down a bit - this is a good reason to look towards risky assets, but this is unlikely to lead to an increase in the bullish trend for the same pound. Most likely, until the end of the month, we will remain within the wide horizontal channel, since we can hardly count on updating monthly highs. The COT report indicated that long non-commercial positions rose by 12,914 to 42,219, while short non-commercial positions decreased by 9,027 to 76,687, which led to the reduction of the negative non-commercial net position to -34,468 from level -56 409. The weekly closing price decreased and amounted to 1.2038 against 1.2180.
Indicator signals:
Moving averages
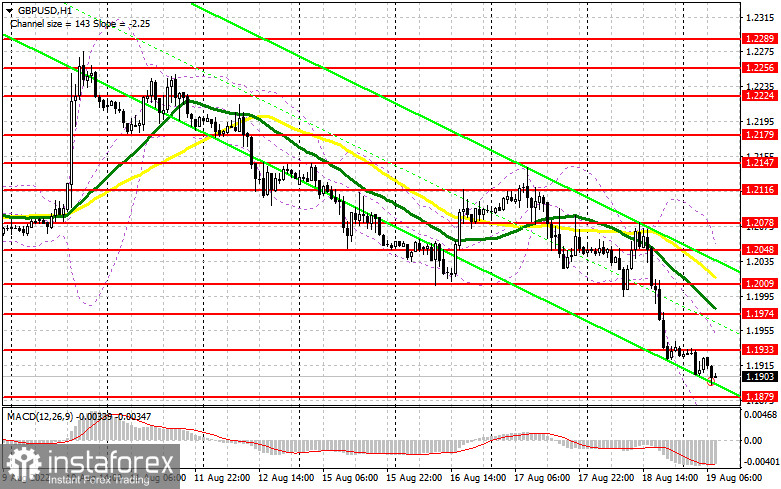
Trading is below the 30 and 50-day moving averages, indicating a return of pressure on the pair.
Note: The period and prices of moving averages are considered by the author on the H1 hourly chart and differs from the general definition of the classic daily moving averages on the daily D1 chart.
Bollinger Bands
In case of growth, the area of 1.2050 will act as resistance. In case of a decrease in the pair, the lower border of the indicator around 1.1855 will act as support.
Description of indicators
- Moving average (moving average, determines the current trend by smoothing out volatility and noise). Period 50. It is marked in yellow on the chart.
- Moving average (moving average, determines the current trend by smoothing out volatility and noise). Period 30. It is marked in green on the chart.
- MACD indicator (Moving Average Convergence/Divergence — convergence/divergence of moving averages) Quick EMA period 12. Slow EMA period to 26. SMA period 9
- Bollinger Bands (Bollinger Bands). Period 20
- Non-commercial speculative traders, such as individual traders, hedge funds, and large institutions that use the futures market for speculative purposes and meet certain requirements.
- Long non-commercial positions represent the total long open position of non-commercial traders.
- Short non-commercial positions represent the total short open position of non-commercial traders.
- Total non-commercial net position is the difference between short and long positions of non-commercial traders.