empty
 
 
29.05.2023 12:40 PM
EUR/USD and GBP/USD: Technical analysis for May 29

EUR/USD

This image is no longer relevant

Higher timeframes

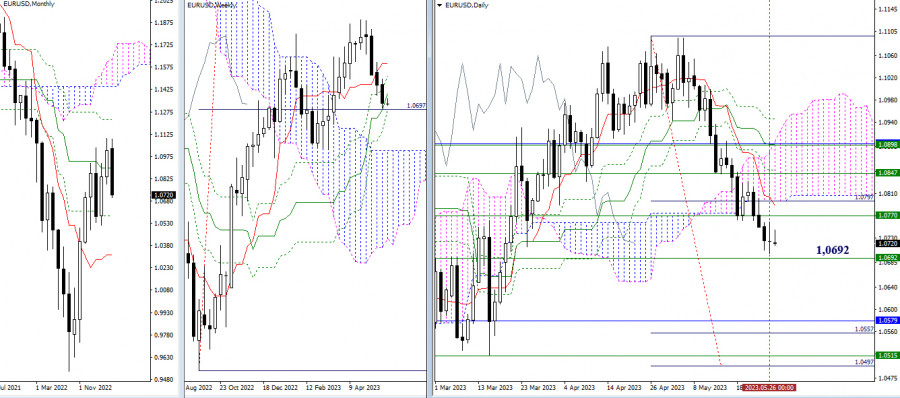
Last week, there was a development of a bearish trend during the day. Consolidation below the Ichimoku cloud led to the formation of a daily downside target (1.0557 - 1.0497). Additionally, a downward correction on the weekly timeframe was observed. As a result, bears aimed to test the strength of the supports of the weekly golden cross and potentially eliminate them. The final level of the cross today is located around 1.0692. If bears fail to realize their plans and the initiative shifts to the opponent's side, the nearest objectives for bulls would be to find support from the weekly medium-term trend (1.0770) and the daily short-term trend (1.0788), as well as to return to the daily cloud (1.0796).

This image is no longer relevant

H4 - H1

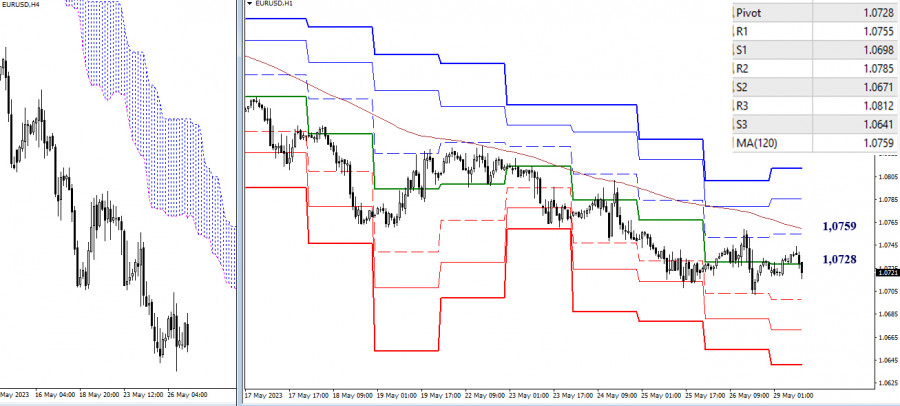
Currently, the bears hold the advantage on the lower timeframes. The pair is trading below key levels at 1.0728 (central pivot point) and 1.0759 (weekly long-term trend). These levels represent the balance of power. If the decline continues within the day, reference points can be marked at 1.0698 - 1.0671 - 1.0641 (classic pivot points). In the event of a breakthrough of key levels (1.0728–59) and consolidation above them, the advantage will shift to bulls, and potential reference points would be 1.0785 - 1.0812 (classic pivot points).

***

GBP/USD

This image is no longer relevant

Higher timeframes

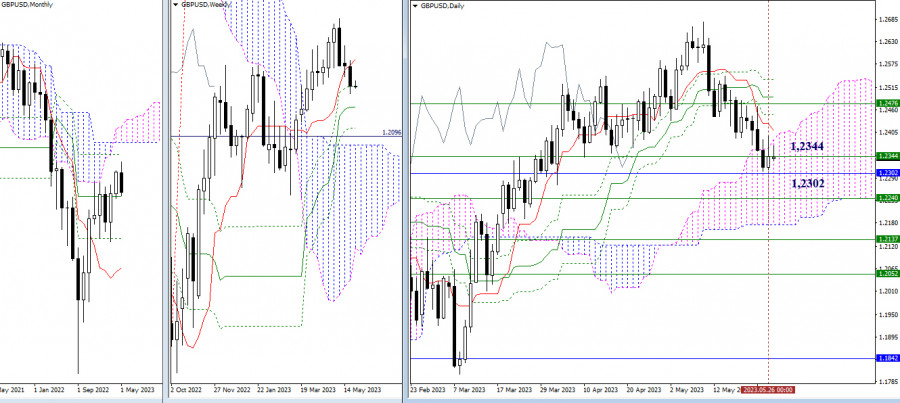
Last week, the pair started testing the monthly medium-term trend (1.2302) and entered the attraction zone of the weekly level (1.2344). As the next bearish reference points, we can note 1.2240 (weekly medium-term trend) and 1.2173 (lower boundary of the daily cloud). If the activity shifts to the bulls' side, the resistances of the daily Ichimoku cross (1.2408 - 1.2449 - 1.2492 - 1.2536) reinforced by the weekly short-term trend (1.2476) could be significant for them.

This image is no longer relevant

H4 - H1

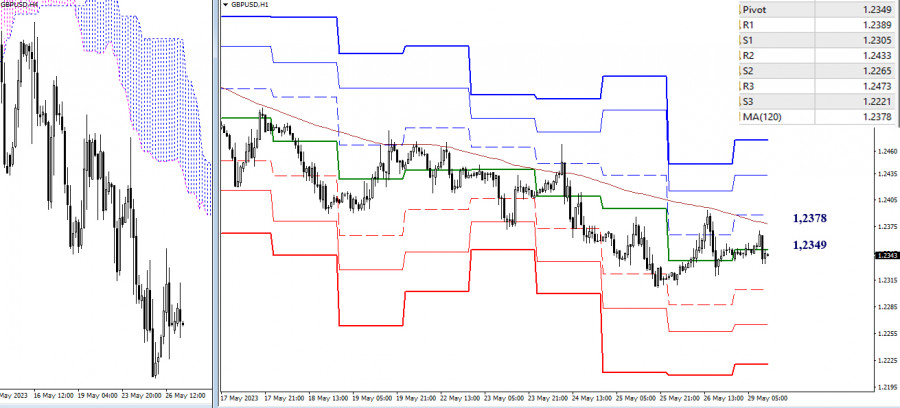
On the lower timeframes, the pair is within a correction zone, but the main advantage is currently on the bears' side. Support levels provided by classic pivot points (1.2305 - 1.2265 - 1.2221) serve as reference points for intraday decline. A breakout and reversal of the weekly long-term trend (1.2378) could change the current balance of power. Resistance levels from classic pivot points (1.2389 - 1.2433 - 1.2473) would become reference points for further upward development.

The technical analysis of the situation uses:

Higher timeframes - Ichimoku Kinko Hyo (9.26.52) + Fibo Kijun levels

Lower timeframes - H1 - Pivot Points (classic) + Moving Average 120 (weekly long-term trend)

Evangelos Poulakis,
انسٹافاریکس کا تجزیاتی ماہر
© 2007-2024
انسٹافاریکس کے ساتھ کرپٹو کرنسی کی معاملاتی تبدیلیوں سے کمائیں۔
میٹا ٹریڈر 4 ڈاؤن لوڈ کریں اور اپنی پہلی ٹریڈ کھولیں۔
  • Grand Choice
    Contest by
    InstaForex
    InstaForex always strives to help you
    fulfill your biggest dreams.
    مقابلہ میں شامل ہوں
  • چانسی ڈیپازٹ
    اپنے اکاؤنٹ میں 3000 ڈالر جمع کروائیں اور حاصل کریں$9000 مزید!
    ہم مئي قرعہ اندازی کرتے ہیں $9000چانسی ڈیپازٹ نامی مقابلہ کے تحت
    اپنے اکاؤنٹ میں 3000 ڈالر جمع کروانے پر موقع حاصل کریں - اس شرط پر پورا اُترتے ہوئے اس مقابلہ میں شرکت کریں
    مقابلہ میں شامل ہوں
  • ٹریڈ وائز، ون ڈیوائس
    کم از کم 500 ڈالر کے ساتھ اپنے اکاؤنٹ کو ٹاپ اپ کریں، مقابلے کے لیے سائن اپ کریں، اور موبائل ڈیوائسز جیتنے کا موقع حاصل کریں۔
    مقابلہ میں شامل ہوں
  • 100 فیصد بونس
    اپنے ڈپازٹ پر 100 فیصد بونس حاصل کرنے کا آپ کا منفرد موقع
    بونس حاصل کریں
  • 55 فیصد بونس
    اپنے ہر ڈپازٹ پر 55 فیصد بونس کے لیے درخواست دیں
    بونس حاصل کریں
  • 30 فیصد بونس
    ہر بار جب آپ اپنا اکاؤنٹ ٹاپ اپ کریں تو 30 فیصد بونس حاصل کریں
    بونس حاصل کریں

تجویز کردہ مضامین

ابھی فوری بات نہیں کرسکتے ؟
اپنا سوال پوچھیں بذریعہ چیٹ.
Widget callback