Review of Wednesday's Trades:
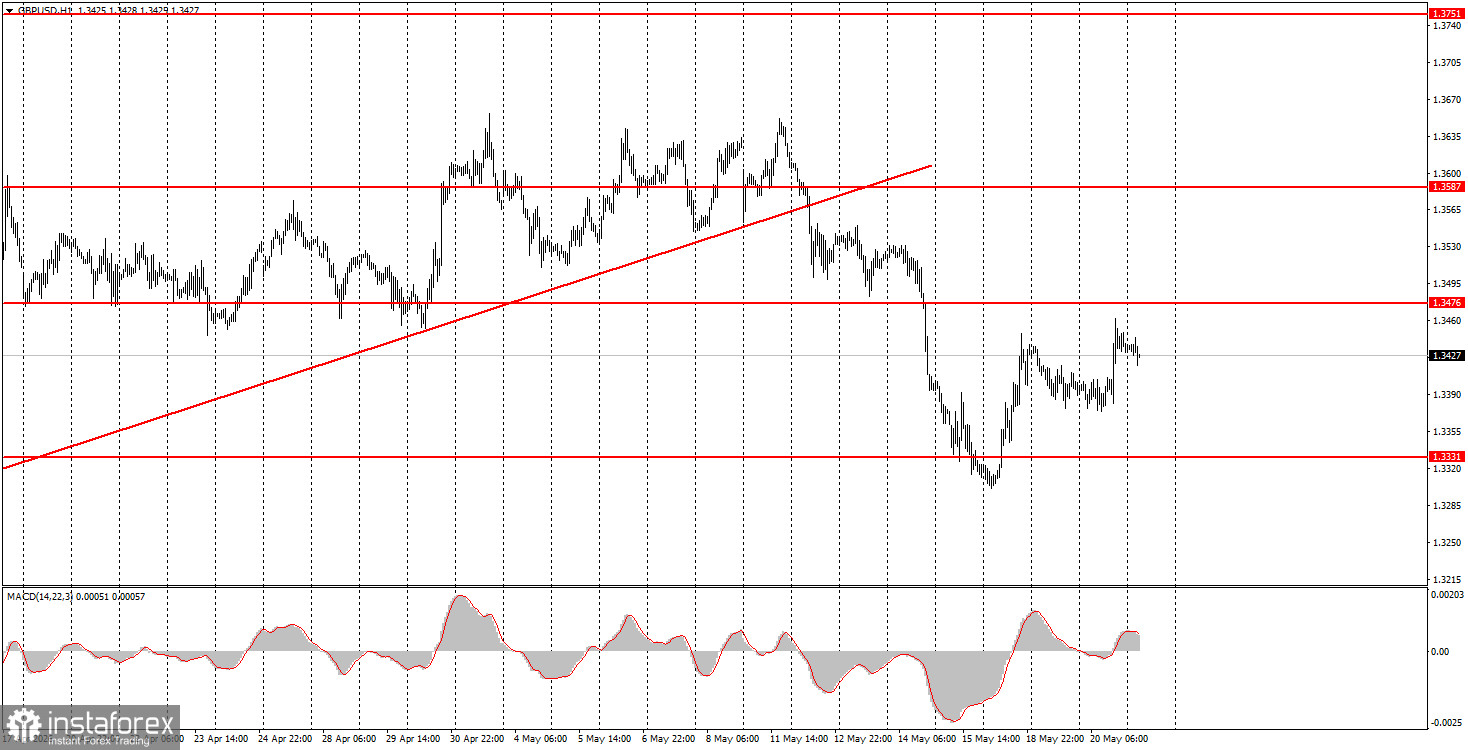
1H Chart Analysis of the GBP/USD Pair
The GBP/USD pair showed interesting movements from the very morning on Wednesday. Not only was an important inflation report for April published in the UK, but it also garnered significant attention, yet the market ignored it. Recall that it became known yesterday about the decision to maintain the Bank of England's key rate at the current level as a result of the June meeting. Inflation fell from 3.3% to 2.8%, so there is no rationale for the Bank of England to tighten monetary policy. However, the market was previously almost certain about a rate hike, so it may now be hit by a wave of disappointment. The market had already begun anticipating the decline in inflation as early as last week, so this factor might have already been priced in. Nonetheless, traders ignored the week's most important report. On the other hand, they could not overlook new statements from Donald Trump, which still lack confirmation. This week, the U.S. president first canceled new strikes on Iran and then reported that negotiations were very productive. Therefore, the British pound has been predominantly rising this week.
5M Chart Analysis of the GBP/USD Pair
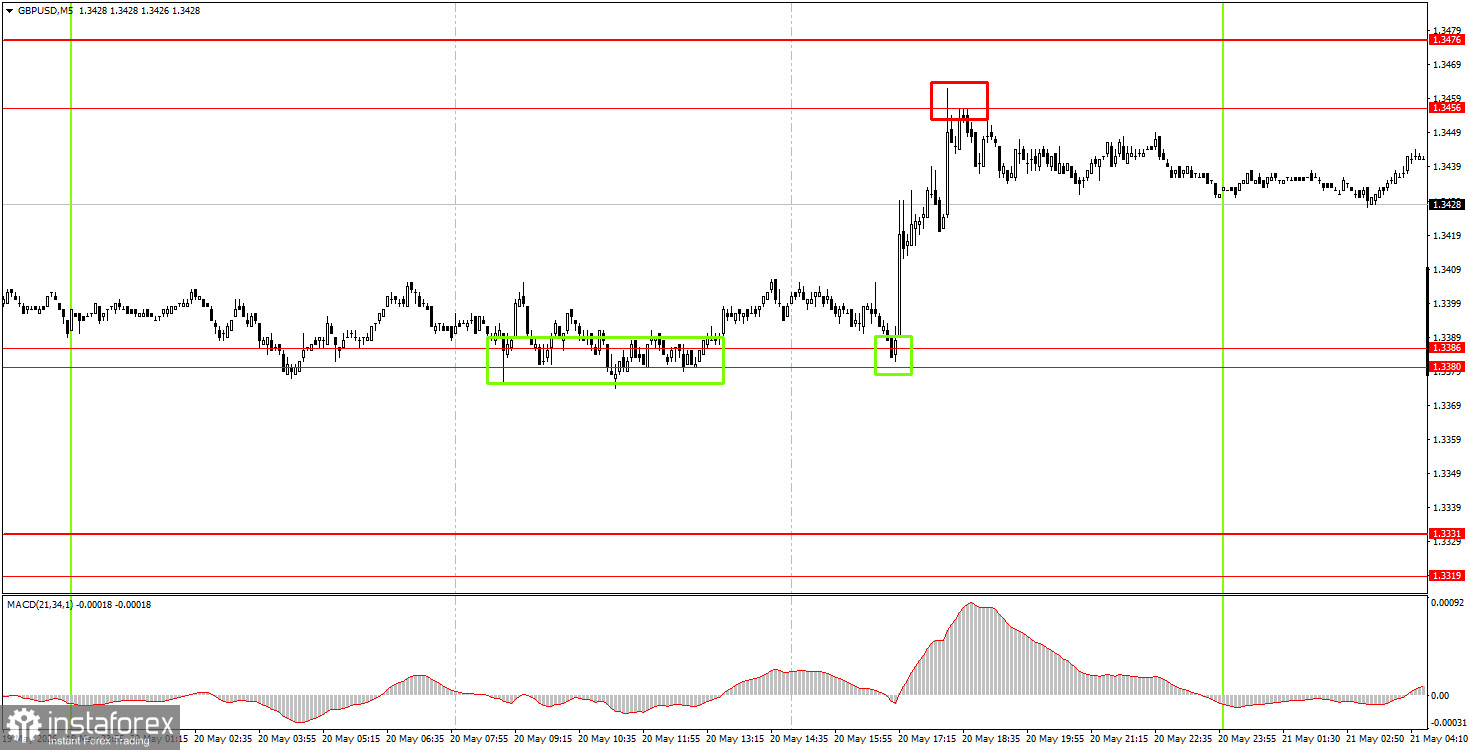
On the 5-minute timeframe on Wednesday, two buy signals and one sell signal were generated. During the European and American trading sessions, the price bounced twice from the 1.3380-1.3386 area, but, of course, without Trump, the pound would not have shown such a powerful rise. The buy signals reinforced each other, with the long position yielding about 50 pips of profit. The sell signal from the area of 1.3456-1.3476 could also be executed.
How to Trade on Thursday:
On the hourly timeframe, the GBP/USD pair continues its downward trend, but the geopolitical backdrop has changed significantly this week, allowing the British currency to rise with confidence. Without a resumption of full-scale war in the Middle East, the dollar cannot expect to grow as it did in February-March. Individual events may still provoke a strengthening, but we do not believe the market will trigger a new wave of risk aversion.
On Thursday, novice traders may open short positions targeting 1.3380-1.3386 if the price bounces from the 1.3456-1.3476 area. A consolidation above the 1.3456-1.3476 area will allow for new long positions targeting 1.3587-1.3598.
On the 5-minute timeframe, current tradable levels include: 1.3175-1.3180, 1.3259-1.3267, 1.3319-1.3331, 1.3380-1.3386, 1.3456-1.3476, 1.3587-1.3598, 1.3631-1.3641, 1.3695, 1.3741-1.3751. Today, indices of business activity are scheduled for publication in the UK and the U.S.; however, the market may well ignore these data points, just as it has this week disregarded reports on unemployment and inflation.
Main Rules of the Trading System:
- The strength of the signal is determined by the time it took to form the signal (bounce or breakout of the level). The less time it took, the stronger the signal.
- If two or more trades were opened near any level based on false signals, all subsequent signals from this level should be ignored.
- In a flat market, any pair can generate many false signals or none at all. Technical levels may be ignored.
- On the hourly timeframe, it is preferable to trade signals from the MACD indicator only in the presence of good volatility and a trend that is confirmed by a trend line or trend channel.
- If two levels are too close together (5-20 pips apart), treat them as a support or resistance zone.
- After a move of 15 pips in the right direction, a Stop Loss should be set to breakeven.
What is on the Charts:
Price levels (areas) of support and resistance – levels that are targets when opening purchases or sales, or sources of signals.
Red lines – channels or trend lines that display the current trend and indicate which direction is preferable to trade now.
MACD indicator (14, 22, 3) – histogram and signal line – a supporting indicator that can also be used as a source of signals.
Important speeches and reports (contained in the news calendar) can significantly influence the movement of the currency pair. Therefore, during their release, trading should be done as cautiously as possible, or one should exit the market to avoid a sharp price reversal against the preceding movement.
Beginners trading in the Forex market should remember that not every trade can be profitable. Developing a clear strategy and effective money management are key to long-term trading success.